


Software
TETIS: Conceptual and distributed hydrological model
TETIS v9 - The TETIS model is a distributed hydrological, sediment cycle and nitrogen cycle model ,
which the basin in regular mesh and its parameter are physically based. It is a global model, which can
be used both for floods and erosion (temporal discretization from minutes to hours) and water resources
management (daily temporal discretization). It also has a powerful automatic algorithm for its effective
parameters and its initial conditions of all state variables calibration. This fact strongly facilitates
its practical implementation.
The advantages of distributed modelling over traditional aggregate and semi-distributed modelling consist
mainly of: i) the best representation of the spatial variability of the phenomena involved in hydrological
processes of the Water Cycle; ii) the ability to obtain results at any point in the basin, without prefixing
them a priori and without using interpolation methodologies; iii) the exploitation of spatial information increasingly
abundant due to the development that in recent years had the computers, digital mapping, geographic information systems
and remote sensing measurements.

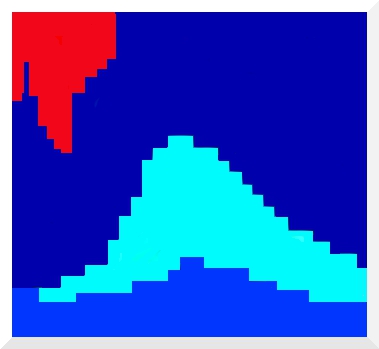
Automatic calibration results in Goodwin Creek Basin (Mississippi, USA), Q01 station, event October 1981.
|
The open group for TETIS users on Linkedin has been created for the interaction between the users and the developers of the distributed hydrological model TETIS. We encourage you to participate raising doubts, errors and any other input that may help us to improve. |
Peak flood flow estimation
Témez method (modified Rational method) - Spreadsheet of Témez Method application (modified Rational method)
to calculate peak flood flows.
Statistical analysis of hydrological extremes
AFINS_2.0 - AFINS is a program for frequency analysis of hydrological extremes (flow or rain),
at one point and using systematic data (measured without any statistical confidence) and/or non-systematic
(with statistical confidence), with the hypothesis of stationarity and independence of the observed sample.
The extremal random variable can be flow or precipitation, being necessarily annual maximum so the probability unit
is the return period in years. The cumulative probability distribution functions that can be used with AFINS are:
- No upper limit: Exponential, Lognormal 2 parameters, Gumbel, Pareto 3 parameters, GEV, TCEV and SQRT-ETmáx.
- Upper limit: EV4, LN4 and TDF.
The estimation methodology is the maximum likelihood method, the parameters can be estimated initially by the Moments method.

AFINS fit obtained with the TCEV probability distribution function to one
systematic data series (exact) of annual maximum daily rainfall.
AFINS was developed using IDL, and can be performed using IDL Virtual Machine 6.1. that lets you run programs built under IDL 6.1, without a license. To run AFINS, you must have on your PC
IDL Virtual Machine 6.1. During the installation, choose installing the virtual machine option. In this case, no license is required.
Riparian vegetation distribution analisys
RibAV 1D v1.0 - Model for the zonation of different riparian vegetation functional types (reach scale) by calculating the rate of evapotranspiration (ETidx) in specific simulation points.
This tool allows for analysis of riparian vegetation response under a wide range of different climate and hydrological scenarios.

Example of result obtained by simulating vegetation functional types with RibAV 1D.
RibAV 2D v1.0 - Model for the zonation of different riparian vegetation functional types (reach scale) by calculating the rate of evapotranspiration (ETidx) in ASCII maps.
This tool allows for analysis of riparian vegetation response under a wide range of different climate and hydrological scenarios.

Example simulation result obtained by functional types of vegetation with 2D RibAV.
Map Comparison Tool for R
R script that analyzes the agreement between two rasters when using nominal scores - This R script compares two ascii maps in terms of success accuracy. Calculations:
- Confusion matrix (integers and proportions), kappa, weighted kappa and CII for all the categories present in ascii maps.
- AUC, omission and commission rates, sensitivity, specificity and proportion of correct instances, for each category independently